Data Analysis Tools
7 minute read
Motorcortex is capable of providing huge amounts of data. It can be very convinient using python tools to proces this data and create plots for example.
Installing required Python Libraries
To use the Motorcortex analysis tools some Python libraries are required. The following steps will show how to install the required libraries.
Installing Matplotlib
The Motorcortex-python-tools package requires matplotlib (https://matplotlib.org/) to manipulate data and create plots.
- Install via apt (recommended):
sudo apt install python3-matplotlib
or Install via pip:
sudo pip3 install matplotlib
Installing Motorcortex-Python-Tools
Motorcortex-python-tools is distributed as an archive file (https://git.vectioneer.com/pub/motorcortex-python-tools/tree/master/dist).
- Save the archive into a folder you have access to. Navigate to that folder and run the following command in a terminal.
sudo pip3 install motorcortex-python-tools-1.2.zip
This will install the library files to /usr/local/lib/… an python executables to /usr/local/bin/
- To check if everything works start python3:
python
import motorcortex
print (motorcortex)
- The output should look like this:
module 'motorcortex' from '/usr/local/lib/python3.7/dist-packages/motorcortex/__init__.py'
Using motorcortex-python-tools
Running Python scripts
Depending on the platform and shell you use, there are slightly different ways to execute the scripts. In the different methods mcx-datalogger.py --help is used as example to execute.
in command line (terminal/cmd) go to the right folder with the terminal and write the following.
python mcx-datalogger.py --help
using python shells (Anaconda/miniconda/pycharm) make sure you are in the right folder and type the line below in the command window of the shell.
mcx-datalogger.py --help
Command line tools
mcx-datalogger
mcx-datalogger is a command-line tool that can connect to a motorcortex server and record a list of signals. It is also capable to be run as a daemon, creating a new datatrace whenever it is triggered by
some signal on the server. The list of signals to be recorded is presented in JSON format, and can be conveniently created by motorcortex-desk.
!!!!!!!! See the motorcortex-desk documentation on how to create a signal-list file. !!!!!!!!!!!!!!!!
“Under construction”
To get help about the mcx-datalogger command, type:
mcx-datalogger.py –help
> mcx-datalogger.py --help

usage: mcx-datalogger.py [-h] -p PARAMETERFILE [-f FILE] [-F FOLDER]
                         [-c COMMENT [COMMENT ...]] [-u URL] [-s CERTIFICATE]
                         [-d DIVIDER] [--trigger TRIGGER]
                         [--triggerinterval TRIGGERINTERVAL]
                         [--triggervalue TRIGGERVALUE]
                         [--triggerop {==,<,>,<=,>=,!=}] [-C] [--noparamdump]

Log data from a MOTORCORTEX Server to a CSV file.

optional arguments:
  -h, --help            show this help message and exit
  -p PARAMETERFILE, --parameterfile PARAMETERFILE
                        JSON file that contains a list of parameters to log.
                        The JSON file shall have the following format:
                        [{"path":"root/signal1"}, {"path":"root/signal2"},
                        ...]
  -f FILE, --file FILE  Specify the filename that the data will be saved to.
                        By default the filename is created based on the
                        current date and time
  -F FOLDER, --folder FOLDER
                        Folder where output files are placed
  -c COMMENT [COMMENT ...], --comment COMMENT [COMMENT ...]
                        Comment to append to filename
  -u URL, --url URL     URL to connect to (Default:
                        wss://192.168.2.100:5568:5567)
  -s CERTIFICATE, --certificate CERTIFICATE
                        Certificate to use when connecting securely. (Default:
                        mcx.cert.crt)
  -d DIVIDER, --divider DIVIDER
                        Frequency Divider; specifies the amount of
                        downsampling that occurs at the server. The server
                        only then sends every N-th sample. Setting the
                        Frequency Divider to 1 will send at the maximum rate
                        that the server supports. (Default: 10)
  --trigger TRIGGER     Path to the signal that is monitored at the given
                        TRGGERINTERVAL. The logger is started whenever the
                        trigger condition is met.
  --triggerinterval TRIGGERINTERVAL
                        Trigger interval in seconds; the interval at which the
                        trigger parameter is checked. (default: 0.500 s)
  --triggervalue TRIGGERVALUE
                        Trigger value; the value the trigger is compared to.
  --triggerop {==,<,>,<=,>=,!=}
                        Trigger operator; the operator that is used for
                        comparison.
  -C, --compress        Compress the traces on the fly using the LZMA
                        algorithm. It creates files with the xz extension.
  --noparamdump         Do not dump parameters to file for each trace.
Some examples of how to use the mcx-dataloger:
mcx-datalogger.py -p parameters.json
This starts recording the signals listed in parameters.json using default values. This creates two files: e.g. 2019-04-30_11-16-06.csv and 2019-04-30_11-16-06.csv.params.
The .params file contains a record of all the “parameter” parameters of the control application (so it does not contain “input” or “output” type parameters), and should be a good representation of the conditions under which the trace has been made.
The .csv file contains the trace data, where the first row is the list of signals that are recorded.
The CSV file can be directly opened in tools like spreadsheet programs, Python or Matlab for further analysis. Or it can be inspected by using the mcx-dataplot tool (see the next section).
mcx-dataloger can also compress the output file on the fly using the --compress option. It may be that the resulting file gets truncated when the mcx-datalogger process is killed in the middle of logging (for instance when the power is switched off); in that case the compressed file may be incomplete and cannot be extracted using the regular unxz command. In this case use the xzcat command to extract the file:
> xzcat file.csv.xz > file.csv
xzcat: file.csv.xz: Unexpected end of input
although xzcat reports an error the file will be extracted completely (up until the point where the logging process was killed). The file can then still be processed further.
mcx-dataplot
The mcx-dataplot is a command-line tool that can conveniently plot data that is recorded by mcx-datalogger and either display it on screen, or output the plot to a file.
To get help at the command line type:
> mcx-dataplot.py --help
usage: mcx-dataplot [-h] [-l] [--output OUTPUT] [-s SIGNALS [SIGNALS ...]]
                    [-x XAXIS] [--drawstyle DRAWSTYLE]
                    [--yrange YRANGE [YRANGE ...]] [--nodateconv]
                    FILENAME

mcx-dataplot

positional arguments:
  FILENAME              Inputfile in CSV format or xv (LZMA) compressed CSV.
                        First line is a list of signal names. First column is
                        interpreted as x-axis by default.

optional arguments:
  -h, --help            show this help message and exit
  -l, --list            List the signals contained in the file and exit
  --output OUTPUT       filename of the output plot file
  -s SIGNALS [SIGNALS ...], --signals SIGNALS [SIGNALS ...]
                        List of signals to plot. Example: -s 1,2:3 4:5. Where
                        "," adds the next signal to the same axis. ":"
                        indicates creation of an additional y-axis in the same
                        plot and <SPACE> creates a new subplot.
  -x XAXIS, --xaxis XAXIS
                        Column to use as x-axis
  --drawstyle DRAWSTYLE
                        interpolation type. One of "default", "steps", "steps-
                        pre", "steps-mid", "steps-post"
  --yrange YRANGE [YRANGE ...]
                        Range of the y-axis
  --nodateconv          Do not convert the first column to a date.
Below are some common examples of how to use the mcx-dataplot
tool.
To get a list of signals available for plotting use the -l option
> mcx-dataplot.py 2019-02-17_21-45-18_file.csv -l
 0 time
 1 root/Control/systemTimeMicroS
 2 root/Control/allPunchesClear
 3 root/Control/materialPositionEncoderTicks
 4 root/Control/materialPositionFiltered
 5 root/Control/materialPosition
 6 root/Control/punchControl01/atMeasureAccuracy
 7 root/Control/punchControl01/atTargetBot
 8 root/Control/punchControl01/atTargetTop
 9 root/Control/punchControl01/PunchControlBot/actualPosition
10 root/Control/punchControl01/PunchControlBot/actualPressureA
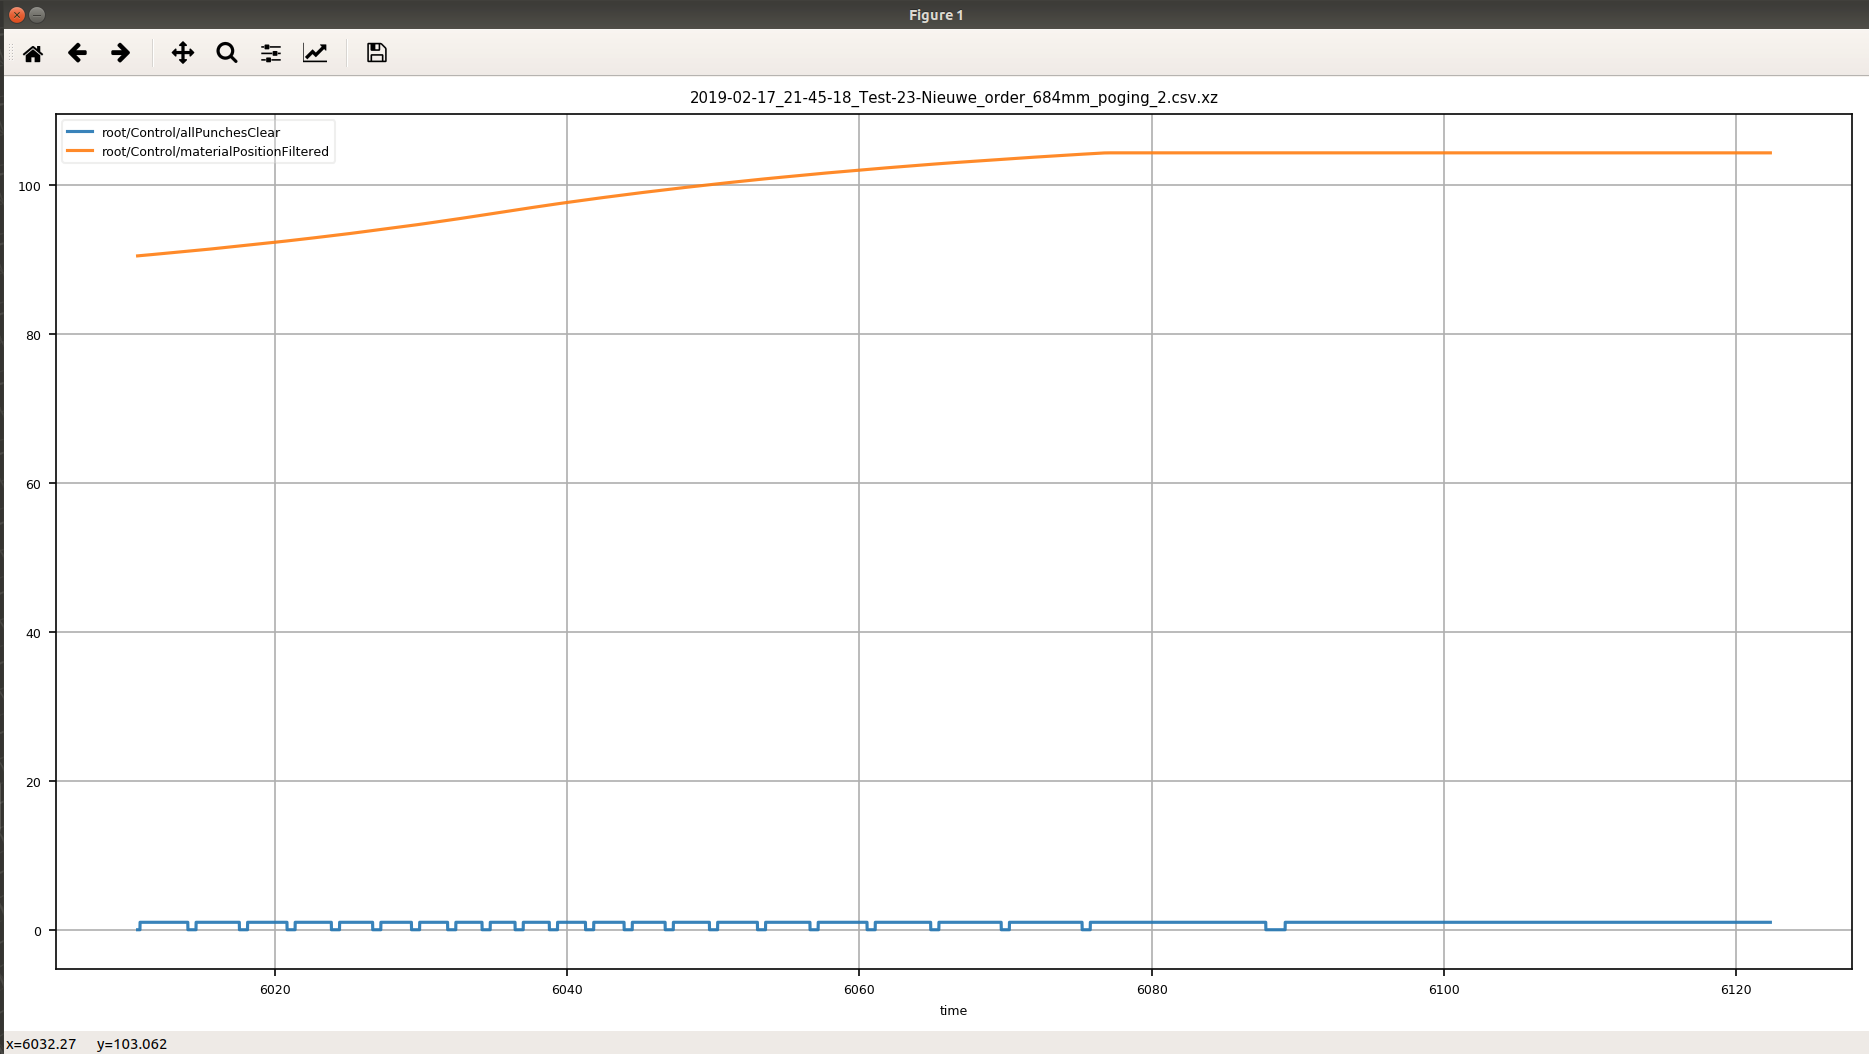
To generate a plot on-screen, plotting columns 2 and 4 in the same plot use:
mcx-dataplot.py 2019-02-17_21-45-18_file.csv -s 2,4
This will display the two signals in the same plot on the same axes.
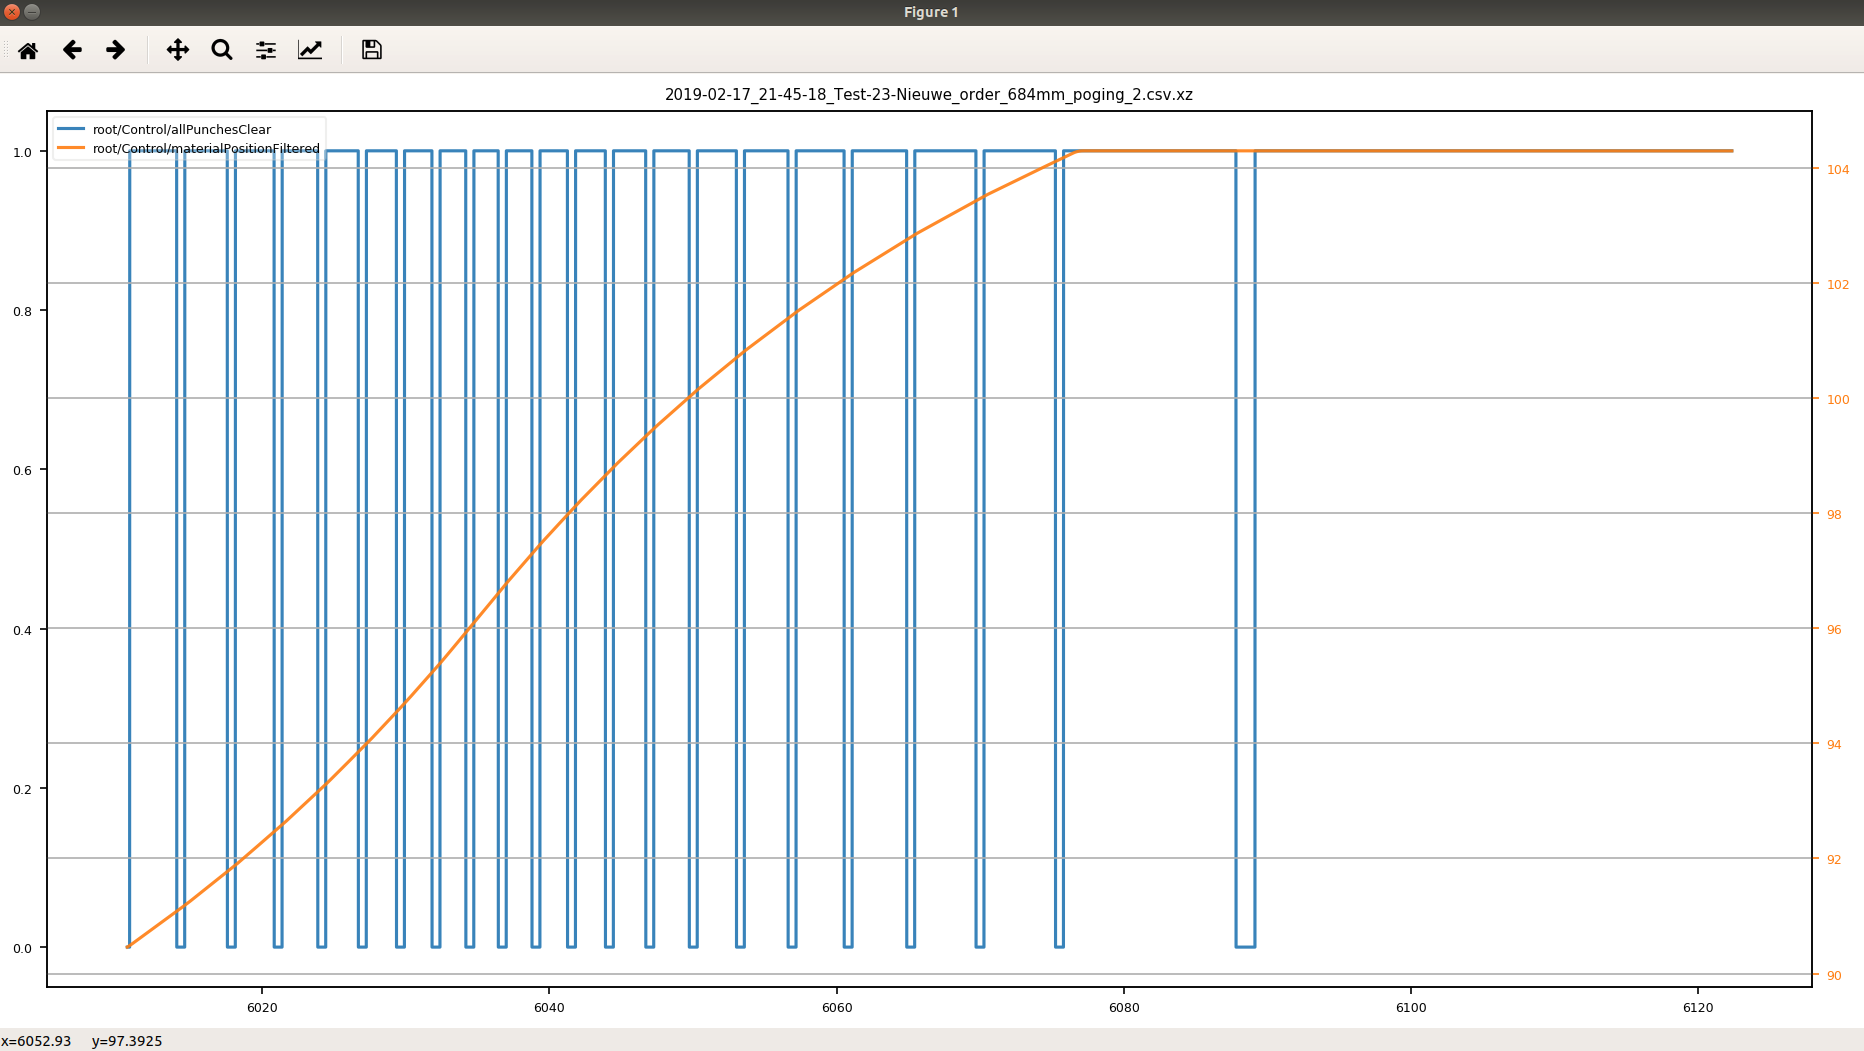
To plot the second signal on a separate y-axis in the same plot use:
mcx-dataplot.py 2019-02-17_21-45-18_file.csv -s 2:4
To plot the second signal in a separate subplot, sharing the same x-axis, use:
mcx-dataplot.py 2019-02-17_21-45-18_file.csv -s 2 4
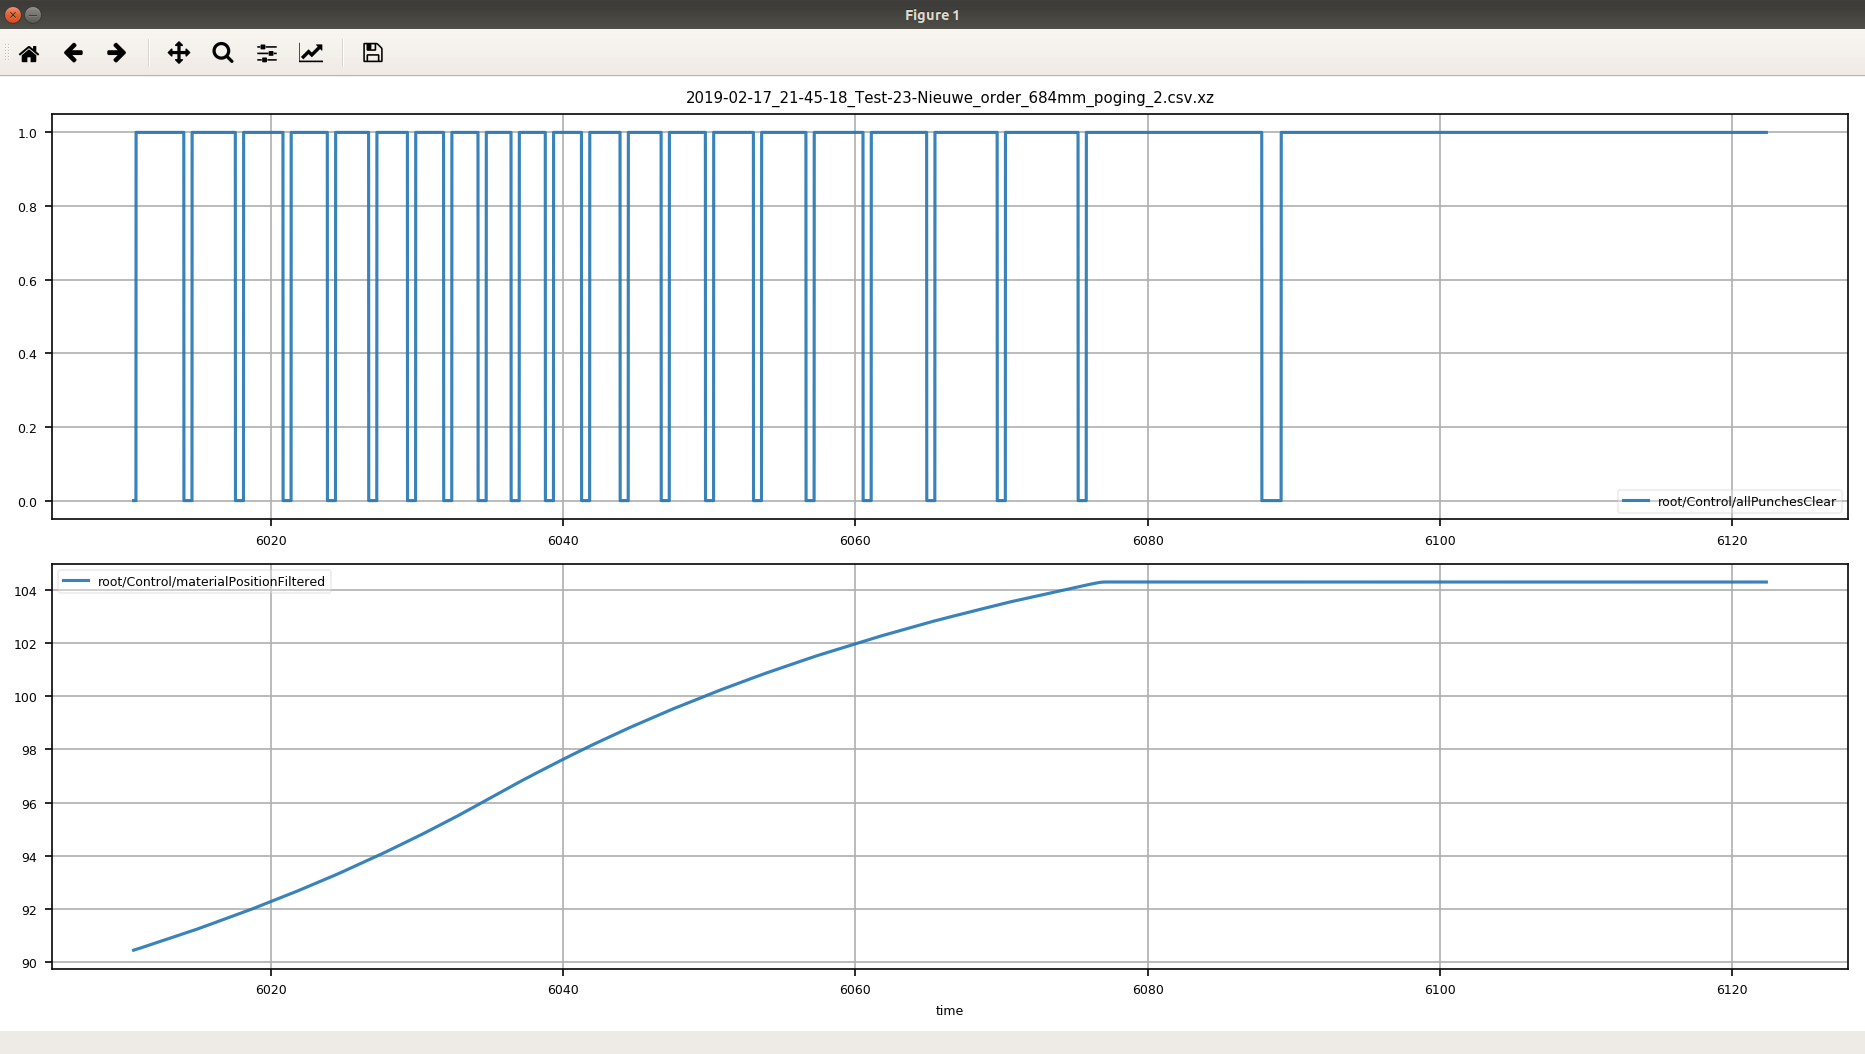
Zooming in one subplot will also change the range of the x-axis in all other subplots.
Using motorcortex-python-tools in your own Python code
To use the datalogger in your own python scripts you first need to import the module
# import the DataLogger module
from motorcortex_tools import DataLogger
# import numpy
import numpy as np
# import matplotlib (optional)
import matplotlib.pyplot as plt
# import time module (required to use sleep())
import time
Then create a DataLogger object. In the example below the DataLogger object is connected to the controller on ip address ‘192.168.2.100’ and subscribes to ‘path/to/param’ with frequency divider of 10.
# Create a DataLogger object and set the options
logger = DataLogger('192.168.2.100', ['path/to/param'], divider=10)
# Start the logger
logger.start()
While the logger is running you can interact with the system by setting some parameters or waiting until you see some response or some time has elapsed.
# do something, like setting a parameter to True
req.setParameter('path/to/another/param', True).get()
# wait a bit
time.sleep(10)
# Stop the logger
logger.stop()
# Close the connection to the server
logger.close()
Now the logger object contains the time traces of the recorded parameters. These traces can be accessed and converted into NumPy Arrays for instance. The time traces are stored in a Dictionary where each trace can be accessed by its path. The time of a trace is stored under the “t” key, the value of the parameter in the “y” key.
# get the time as a vector
t = np.array(logger.traces['path/to/param']["t"]).transpose()
# get the first column of the corresponding values of the parameter
y = np.array(logger.traces['path/to/param']["y"][0]).transpose()
The NumPy arrays can then be processed by NumPy or Matplotlib or PyLab tools. Here is an example of plotting the trace in Matplotlib.
plt.plot(t,y)
plt.show()