Troubleshoot EtherCAT
8 minute read
When an EtherCAT device does not start, the EtherCAT master writes the reason to the kernel log, and Motorcortex writes its own messages to the application log. This page shows where to find both, and explains the master messages you are most likely to see.
Where each error happens
Every device, a slaveAn EtherCAT device on the bus. The controller is the master: it configures every slave and exchanges the process data with it each cycle. in EtherCAT terms, passes through the states INIT, PREOP, SAFEOP and OP before it exchanges data with the application. The master configures the slave in PREOP and then asks it to move on. The messages below appear at the step where the configuration does not fit the device. Click a message to read the fix.
In the messages, 0-main-X names the master (0), its main Ethernet device (main) and the position of the slave on the bus (X), counted from 0. The first device after the controller is 0-main-0.
All messages at a glance
| Message | Cause | Fix |
|---|---|---|
| Slave does not support changing the PDO mapping! | The PDO entries you configured differ from the fixed mapping of the device. | Make the entries match what the device reports. |
| Failed to set OP state, slave refused state change | The device does not accept its configuration. The next line names the reason. | Look up the AL status message that follows. |
| AL status message 0x001B: “Sync manager watchdog” | The device did not receive new output data within its watchdog time. | Compare the sync managers with the ESI file. |
| AL status message 0x0030: “Invalid DC SYNCH configuration” | The distributed clock settings do not suit the device. | Set the distributed clock from the ESI file. |
| Failed to determine PDO sync manager for FMMU! | The device’s SII does not describe the sync manager that the PDOs are assigned to. | Override the SII data of the device. |
Collect the logs
To find the cause, look at these sources. On the support forum, post their output with your question.
| Source | How to get it | What it shows |
|---|---|---|
| Motorcortex log | mcx-lastlog, a download, or the log screen of the application |
What the application did at start-up, including every EtherCAT link it made |
| Kernel log | dmesg on the controller |
The EtherCAT master messages that this page explains |
| Slave list | ethercat slaves, or ethercat slaves -v for details |
The state of every device and whether it has the error flag |
| Master state | ethercat master |
The phase of the master, the number of slaves, and the link state and frame counters of its Ethernet devices |
| System journal | journalctl |
The messages of the system services |
ethercat slaves prints one line per device: its position on the bus, its alias and its position relative to that alias, its state, a flag and its name. A + flag means no error; E means that the scan or the configuration of that device failed. This example line is from the help text of the ethercat tool:
1 5555:0 PREOP + EL3162 2C. Ana. Input 0-10V
Motorcortex log file
The Motorcortex log records what the application does. You can get it in several ways:
- With the application running: download the log from the System Logs on the Diagnostics tab of the Robot App, or view the current log in the error handler screen of the GUI.
- With the application stopped: log in with SSH and run
mcx-lastlogto show the last log, or open one of the log files. - In a browser: open
https://controller_ip_address/log/browse/The IP address of your controller. In most cases 192.168.2.100. to download the log files.
To check whether the application is running, see Start, stop and restart.
The log has three parts:
- Application information: the component versions, the hardware key, the active components and features, and the license.
- System config: the contents of config.json.
- System events: one line per event, marked with its level:
| Level | Meaning |
|---|---|
INFO |
Something succeeded |
INFO_SM |
A state machine changed state |
DEBUG |
Details for debugging |
WARNING |
Something failed, but the application carries on |
ERROR |
Something failed |
FATAL |
The application stopped; the message says why |
Kernel log
The EtherCAT master runs in the Linux kernel, so its messages go to the kernel log. Log in to the controller with ssh and run dmesg. When the application reports a bus or slave error, the kernel log usually tells you which device caused it and why.
Kernel messages and how to fix them
After each fix, deploy the adjusted EtherCAT configuration to the controller and check with dmesg whether the message is gone.
EtherCAT WARNING 0-main-X: Slave does not support changing the PDO mapping!
Some devices have a fixed PDO mapping: the manufacturer does not let you choose which entries a PDO contains. When your configuration asks for other entries, the master warns and prints both mappings:
[  388.264575] EtherCAT WARNING 0-main-1: Slave does not support changing the PDO mapping!
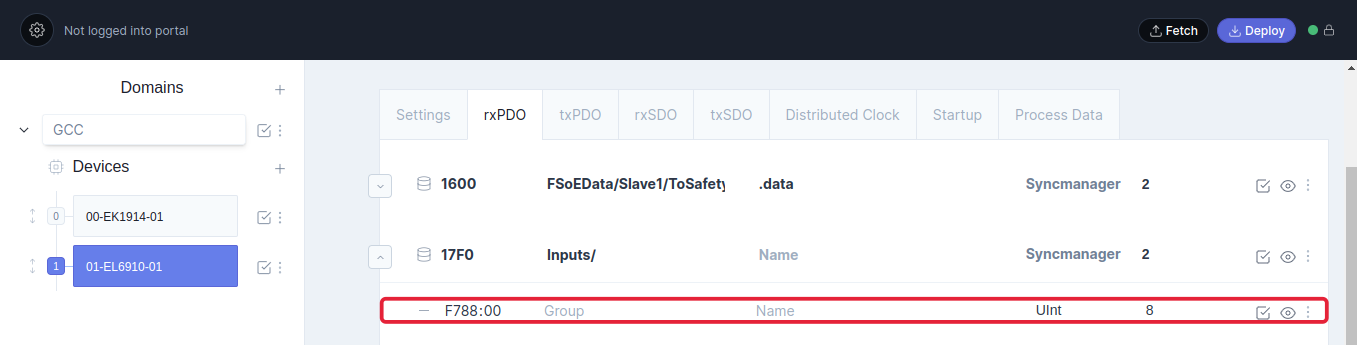
[  388.264577] EtherCAT WARNING 0-main-1: Currently mapped PDO entries: 0xF788:00/8. Entries to map: 0xF788:00/16
Currently mapped PDO entries is what the device has; Entries to map is what you configured. Each entry is written as index, subindex and bit length. In this example the device on position 1 maps entry 0xF788:00 with 8 bits, and the configuration asks for 16. In the ECAT tool, change the bit length of entry 0xF788:00 from 16 to 8.
EtherCAT ERROR 0-main-X: Failed to set OP state, slave refused state change (SAFEOP + ERROR)
The device on position X stayed in SAFEOP and set its error bit instead of moving to OP. It does not accept part of its configuration, usually the sync managers or the distributed clock.
The master then reads the reason from the device and prints it on the next line, as an AL status message. The two you meet most often are:
EtherCAT ERROR 0-main-X: AL status message 0x001B: “Sync manager watchdog”.
The device on position X did not receive new output data within its sync managerA sync manager is a buffer in the device that holds one direction of data: the mailbox out or in, the outputs or the inputs. Each PDO is assigned to one sync manager. watchdog time. A common cause is a sync manager setting that differs from the manufacturer’s ESI file.
Compare the Process Data of the device with its ESI file. In this example the Control Byte of sync manager 2 is #x24, while the ESI file has #x64. Bit 0x40 of the control byte switches the sync manager watchdog on, so the two settings differ in exactly that bit.
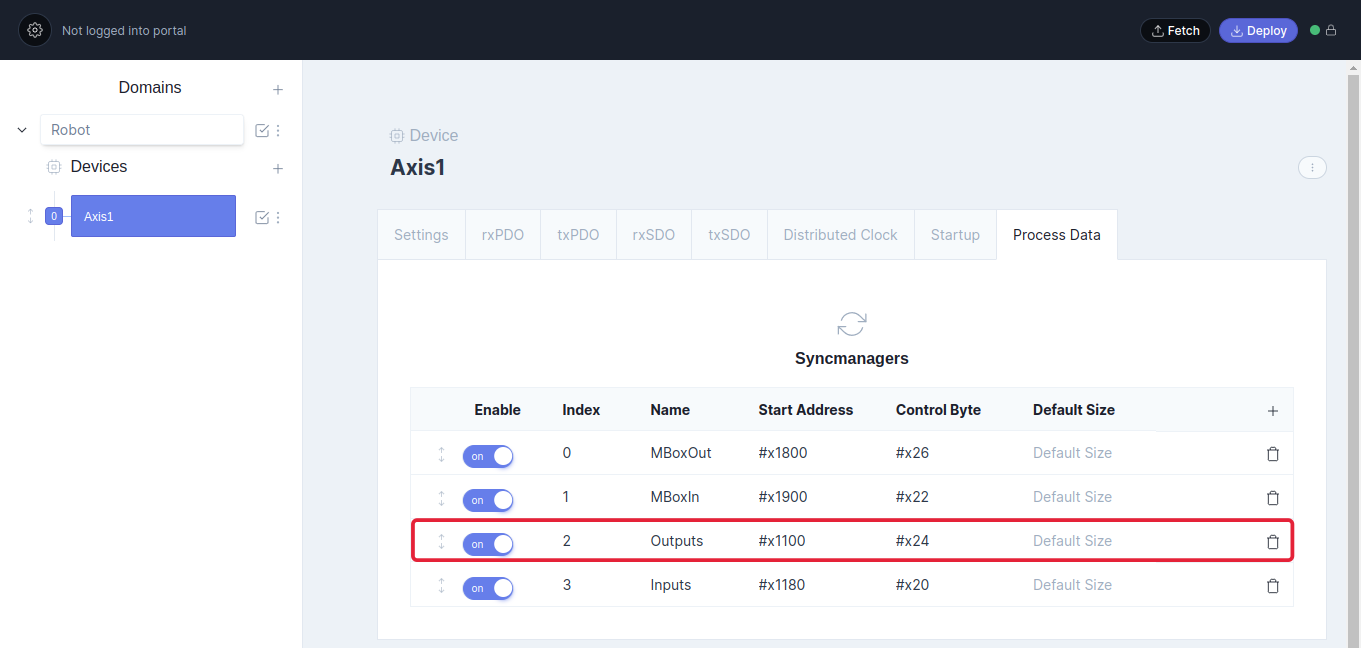
Set the sync managers as the ESI file describes them to resolve the error.
EtherCAT ERROR 0-main-X: AL status message 0x0030: “Invalid DC SYNCH configuration”.
The device on position X expects a distributed clock setting that it did not get, or got with values it cannot use. The ESI file lists the settings the device supports as operation modes (OpMode).
As an example, take the EL5101-0011 counter. It can read its counter value several times per cycle (oversamplingReading a value several times within one bus cycle. The number of readings per cycle is the oversampling factor. ). This is its operation mode with the default oversampling factor of 1, from the ESI file:
<OpMode>
    <Name>DC1</Name>
    <Desc>DC Oversampling 1</Desc>
    <AssignActivate>#x730</AssignActivate>
    <CycleTimeSync0 Factor="1">0</CycleTimeSync0>
    <ShiftTimeSync0 Factor="1" Input="0">0</ShiftTimeSync0>
    <CycleTimeSync1 Factor="-1">0</CycleTimeSync1>
    <ShiftTimeSync1>0</ShiftTimeSync1>
    <Sm No="2">
        <Pdo>#x1600</Pdo>
    </Sm>
    <Sm No="3">
        <Pdo>#x1a00</Pdo>
        <Pdo>#x1a01</Pdo>
        <Pdo>#x1a10</Pdo>
    </Sm>
</OpMode>
A positive Factor multiplies the cycle time of the EtherCAT task; a negative one divides it. With Factor="1" the SYNC0 cycle equals the EtherCAT cycle; with Factor="-1" the SYNC1 cycle does too.
On the Distributed Clock tab of the device, pick the operation mode under Select a Distributed Clock Preset when the ESI file is loaded, or enter the values by hand. Assign Activate takes the hex value from the ESI file, #x730, or its decimal value, 1840; the tool converts a decimal number to hex.
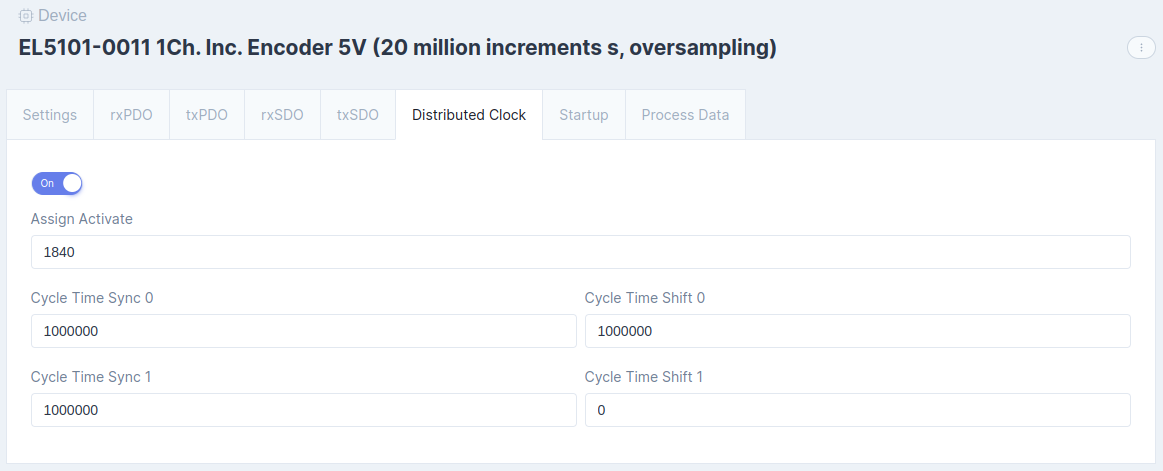
For the EL5101-0011, the PDO configuration also changes with the oversampling factor: each operation mode lists its own PDOs per sync manager.
Failed to determine PDO sync manager for FMMU!
This error comes with a warning such as:
EtherCAT WARNING 0-main-7: PDOs configured for SM3, but slave does not provide the sync manager information!
The device on position 7 has incomplete SIISlave Information Interface: the memory in the device that describes it to the master, including its sync managers. content: it does not describe sync manager 3, to which the configuration assigns PDOs. Override the SII data of the device to solve this.
Errors in the application
The error handler of the GUI shows the warnings and errors of the application. Two of them come from the EtherCAT bus.
ES_Slave_Error
A drive reported an error. To read which one, go to Diagnostics > Drive Data Objects (SDO) in the Robot App and press READ SDOs. This reads the drive error code and its description.
ES_Bus_Error
The EtherCAT bus or one of its domains has an error: its error parameter under root/Ethercat is set. Possible causes are:
- an incorrect station alias in the configuration;
- enabling drives that are not configured, or that the master does not find on the bus.
See Parameters in the tree for when a domain sets its error.