Dataplot Tab
3 minute read
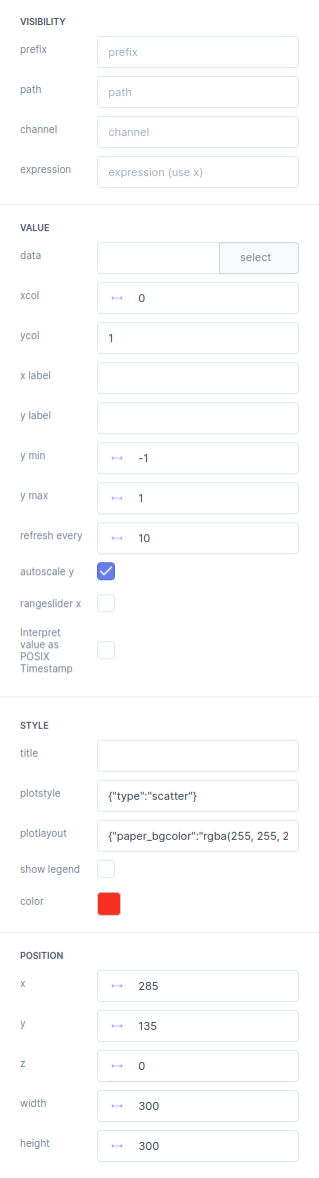
Will add a dataplot output widget to the grid. When a dataplot is selected the Inputbox on the right of the screen will start showing the dataplot properties.
| Bar | Description |
|---|---|
| VISIBILITY | In the Visibility bar you can select the Parameter in the Parameter tree that will make this your element show up. Per default no path will always make a element show up. |
prefix |
In the prefix you fill in the path of a parameter. A prefix is mainly useful for editing multiple paths of parameters. |
path |
This path manipulates the visibility of the element and can be selected from the parameter tree. |
channel |
If a selected parameter is a array you can select the desired channel of the array here. |
expression |
With the expression you can manipulate the presentation of the output. For example convert Meters to Inches. The raw parameter is called x. |
| VALUE | |
data |
Here you can choose your .csv or .json file containing the data for the plot. |
xcol |
In the xcol you determine the column-index from the .csv or .json file to be shown as the x-axis of the plot. E.g. 0 |
ycol |
In the ycol you determine the column-indices from the .csv or .json file to be used for the values on the y-axis of the plot. E.g. [1,2,3] |
xlabel |
The text on the x axis can be changed by changing the x label text. |
ylabel |
The text on the y axis can be changed by changing the y label text. |
y min |
The minimum Y
value is determined here. |
y max |
The maximum Y
value is determined here. |
refresh every |
Here you select how many times the plot gets refreshed per seconds. |
autoscale Y |
The auto scale y
check box makes it possible to automatically scale the Y axis of the plot. |
rangeslider X |
The rangeslider x
check box makes it possible to hide and show the range slider. |
Interpret value as POSIX Timestamp |
This ` check box makes it possible to interpret value as POSIX timestamp. |
| STYLE | |
title |
The title of the Plot can be defined here. |
plotstyle |
See the documentation of Plotly https://plotly.com/javascript/reference/layout/ |
plotlayout |
See the documentation of Plotly https://plotly.com/javascript/reference/layout/ |
show legend |
The show legend
check box makes it possible to turn on or off the legend of the plot. |
color |
Here you determine the color
of your plot line. |
| POSITION | |
x |
The x
position of a element is defined here. |
y |
The y
position of a element is defined here. |
z |
The z
position of a element is defined here. |
width |
The width
of a element is defined here. |
height |
The height
of a element is defined here. |
