mcx-datalogger Tool
8 minute read
Motorcortex is capable of providing huge amounts of data. It can be very convenient using python tools to process this data and create plots, for example. A convenient way to log data from a MOTORCORTEX server is to use the command-line tool mcx-datalogger.py tool which is part of the motorcortex-python-tools package.
The documentation for this section has been split up into the section:
- Install: How to install the motorcortex-python-tools package which contains the mcx-datalogger tool and more.
- Command-line tool: How to use the mcx-datalogger command-line tool.
- Service: How to setup a service to run the mcx-datalogger automatically on boot.
- Data plotter: How to use the mcx-dataplot command-line tool to plot data logged with the mcx-datalogger.
- Python: How to use the datalogger in your own python scripts.
Motorcortex-python-tools can be downloaded and installed via pip and on the latest motorcortex RTOS images it is already pre-installed.
pip install motorcortex-python-tools
The files are stored on motorcortex-python-tools. Here you can also find examples of how to use the datalogger and the dataplotter.
The files can also be cloned directly from the repository:
git clone https://git.vectioneer.com/pub/motorcortex-python-tools.git
mcx-datalogger.py is a command-line tool for logging data from a MOTORCORTEX Server to a CSV file. It offers flexible options for specifying parameters, output files, connection details, and advanced logging features.
Usage
mcx-datalogger.py [-h] -p PARAMETERFILE [-f FILE] [-F FOLDER]
                  [-c COMMENT [COMMENT ...]] [-u URL] [-s CERTIFICATE]
                  [-d DIVIDER] [--trigger TRIGGER]
                  [--triggerinterval TRIGGERINTERVAL]
                  [--triggervalue TRIGGERVALUE]
                  [--triggerop {==,<,>,<=,>=,!=}] [-C] [--noparamdump]
Arguments
-h, --help
Show help message and exit.-p PARAMETERFILE, --parameterfile PARAMETERFILE
Required. JSON file with a list of parameters to log. Format:[ {"path": "root/signal1"}, {"path": "root/signal2"} ]-f FILE, --file FILE
Output filename. Defaults to a name based on current date and time.-F FOLDER, --folder FOLDER
Output folder for files.-c COMMENT [COMMENT ...], --comment COMMENT [COMMENT ...]
Comment(s) to append to filename.-u URL, --url URL
URL to connect to. Default:wss://192.168.2.100:5568:5567-s CERTIFICATE, --certificate CERTIFICATE
Certificate for secure connection. Default:mcx.cert.crt-d DIVIDER, --divider DIVIDER
Frequency divider for downsampling. Sends every N-th sample. Default:10--trigger TRIGGER
Path to signal monitored for triggering logging.--triggerinterval TRIGGERINTERVAL
Trigger interval in seconds. Default:0.500--triggervalue TRIGGERVALUE
Value to compare trigger signal against.--triggerop {==,<,>,<=,>=,!=}
Operator for trigger comparison.-C, --compress
Compress traces using LZMA (creates.xzfiles).--noparamdump
Do not dump parameters to file for each trace.
Example
-
ssh to your Motorcortex application or go on your local machine to Cockpit.
-
Go to the
$HOME$folder, or a folder of your choice where you have write permissions.cd ~ -
Create a parameter file
params.jsonwith the following content:cat > params.json <<'JSON' [ {"path": "root/AxesControl/axesPositionsInput"}, {"path": "root/AxesControl/axesPositionsActual"} ] JSON -
Run the command-line tool to log the parameters defined above: (Make sure Motorcortex is running)
mcx-datalogger.py -p params.json -f output.csv -u wss://192.168.2.100
The mcx-datalogger.py tool can be set up to run as a service on a MOTORCORTEX RTOS system. This allows the datalogger to start automatically on boot and log data continuously without manual intervention. This can be particularly useful for long-term data acquisition tasks.
Setting up mcx-datalogger as a Service
-
Create a parameters file in JSON format that specifies the parameters you want to log. Save this file in a convenient location, e.g.,
/home/admin/parameters.json.cat > params.json <<'JSON' [ {"path": "root/AxesControl/axesPositionsInput"}, {"path": "root/AxesControl/axesPositionsActual"} ] JSON -
Create an output folder, for example:
mkdir /home/admin/logs -
Create a service file for the datalogger. You can use a text editor to create a file named
mcx-datalogger.service(or another name of your preferene) in the/etc/systemd/system/directory:sudo nano /etc/systemd/system/mcx-datalogger.service -
Add the following content to the service file, adjusting the
ExecStartline with the appropriate command-line arguments for your logging needs:[Unit] Description=Motorcortex Data Logger Service After=ethercat.target StartLimitIntervalSec=0 [Service] Type=simple ExecStartPre=/bin/sleep 5 ExecStart=mcx-datalogger.py -p parameters.json -F /home/admin/logs -C WorkingDirectory=/home/admin User=admin Restart=always RestartSec=1 [Install] WantedBy=motorcortex.service -
Restart Motorcortex to apply the changes and start the service:
sudo motorcortex restart -
Service is running!
Managing the Service
To manage the mcx-datalogger service, you can use the systemctl command or you can use the Motorcortex Cockpit interface.
With systemctl, you can check the status of the service with:
sudo systemctl status mcx-datalogger.service
To start, stop, or restart the service, use the following commands:
sudo systemctl start mcx-datalogger.service
sudo systemctl stop mcx-datalogger.service
sudo systemctl restart mcx-datalogger.service
mcx-dataplot.py is a command-line tool for plotting data from a MOTORCORTEX CSV file or LZMA-compressed CSV file. It offers flexible options for specifying signals to plot, axes, output files, and plot customization. You can also write your own python scripts to plot data using the datalogger module.
Note
mcx-dataplot.py does work in the terminal of a motorcortex application due to a packaging issue. But on your own local device you can use it.
Usage
mcx-dataplot.py [-h] [-l] [--output OUTPUT] [-s SIGNALS [SIGNALS ...]]
              [-x XAXIS] [--drawstyle {default,steps,steps-pre,steps-mid,steps-post}]
              [--yrange YRANGE [YRANGE ...]] [--nodateconv]
              [file]
Arguments
-h, --help
Show help message and exit.-l, --list
List the signals contained in the file and exit.--output OUTPUT
Filename of the output plot file (e.g., plot.png). If not specified, the plot is displayed interactively.-s SIGNALS [SIGNALS ...], --signals SIGNALS [SIGNALS ...]
List of signals to plot. Format: space-separated for subplots, comma-separated for same axis, colon-separated for new y-axis.
Example:-s 1,2:3 4:5creates two subplots: first with signals 1 and 2 on same axis and 3 on secondary axis, second with 4 and 5 on separate axes.-x XAXIS, --xaxis XAXIS
Column index to use as x-axis (0-based). Default: 0.--drawstyle {default,steps,steps-pre,steps-mid,steps-post}
Interpolation type for lines. Default:default.--yrange YRANGE [YRANGE ...]
Range of the y-axis (min max). If one value, sets minimum; if two, sets min and max.--nodateconv
Do not convert the first column to a date.file
Input file in CSV format or LZMA-compressed CSV (.xz). First line is signal names. Default:data.csv.
Example
-
Ensure you have a CSV file with logged data (e.g., from
mcx-datalogger.py). -
List available signals in the file:
mcx-dataplot.py -l data.csvOutput example:
0 timestamp 1 motor_pos 2 motor_vel 3 sensor_temp -
Plot signals 1 and 2 on the same axis, and 3 on a secondary y-axis in one subplot:
mcx-dataplot.py output.csv.xz -s 1,2:3 --output plotting.png -
Plot multiple subplots: first subplot with signal 1, second with signals 2 and 3 on separate axes, save to file:
mcx-dataplot.py output.csv.xz -s 1 2:3 --output plotting.png -
Plot with custom x-axis (column 0 as timestamp), y-range, and steps interpolation:
mcx-dataplot.py output.csv.xz -s 1:2 -x 0 --yrange 0 100 --drawstyle steps --output plotting.png
The DataLogger module in the motorcortex-python-tools package provides an easy way to log data from a MOTORCORTEX server in your own python scripts.
You can use the DataLogger module to log data from any parameter path on the server, and store the data in memory for further processing. While logging, you can also use the request module to set parameters on the server to interact with the system.
Example of using the DataLogger in Python Scripts
With this example we will create a simple python script that uses the DataLogger module to log some data from a MOTORCORTEX server and plots it using Matplotlib.
-
import the required modules:
# import the DataLogger module from motorcortex_tools import DataLogger # import numpy import numpy as np # import matplotlib (optional) import matplotlib.pyplot as plt # import time module (required to use sleep()) import time -
create a DataLogger object and start the logger:
# Create a DataLogger object and set the options
logger = DataLogger('192.168.2.100', paths = ['root/AxesControl/axesPositionsActual'], divider=10, certificate='mcx.cert.crt')
# Start the logger
logger.start()
For this example we will plot the actual axes positions of all axes. The
pathsargument is a list of parameter paths to log. Thedivideroption sets the logging frequency. In this case the logger will log every 10th sample. Thecertificateoption is used to specify the certificate file to use for secure connections. -
do something while the logger is running:
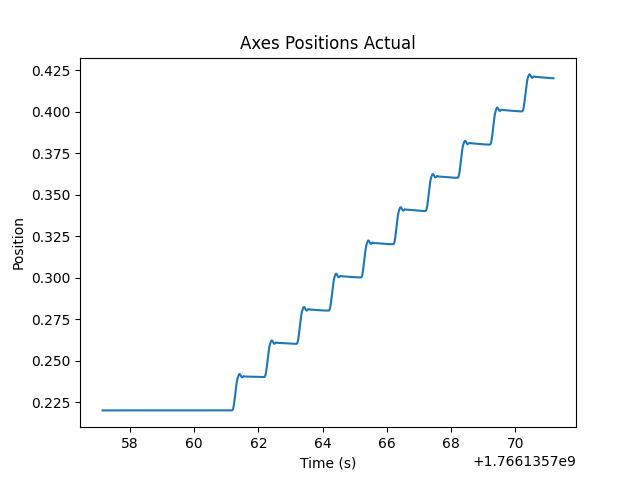
reply = logger.req.setParameter("root/Logic/stateCommand", 2)  # Start the robot
print(f"Set to running state: {reply}")
time.sleep(2)
reply = logger.req.setParameter("root/Logic/modeCommand", 3).get()
print(f"Set to manual joint mode: {reply}")
time.sleep(2)
for _ in range(10):
    logger.req.setParameter("root/ManipulatorControl/hostInJointVelocity", [0.1, 0.0, 0.0, 0.0, 0.0, 0.0]).get()
    time.sleep(1)
logger.req.setParameter("root/Logic/stateCommand", 0)  # Stop the robot
This will start the robot, set it to manual joint mode, and then move the first joint with a velocity of 0.1 for 10 seconds.
-
Plot the results:
# get trace data
trace = logger.traces['root/AxesControl/axesPositionsActual']
t = np.array(trace['t'])
y = np.array(trace['y'][0])
plt.plot(t, y)
plt.title('Axes Positions Actual')
plt.xlabel('Time (s)')
plt.ylabel('Position')
plt.savefig('plot.png')
This uses the time traces of the logger object to create a plot of the axes positions over time. The time is stored in the
tkey of the trace dictionary, and the values are stored in theykey.The resulting plot should look something like this: