Exporting
4 minute read
The Export panel writes trace data to CSV: either a range out of what is already plotted, or a continuous recording of a live session.
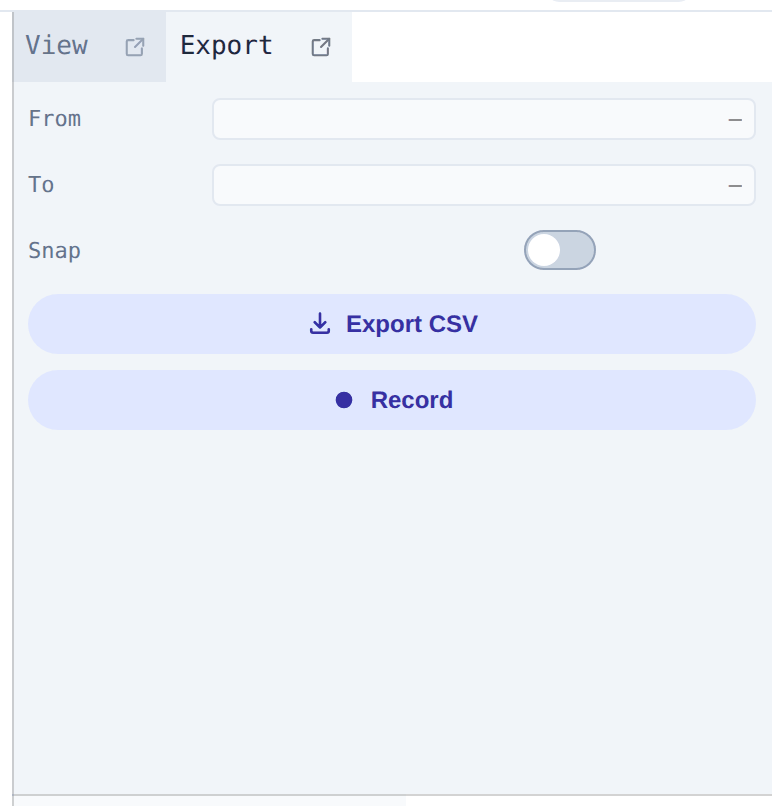
The panel is split by where the data comes from: Record, under Live data, as it streams in, and Select time range, under Data already plotted. Both exports contain visible traces only; hidden traces are left out.
Exporting a range
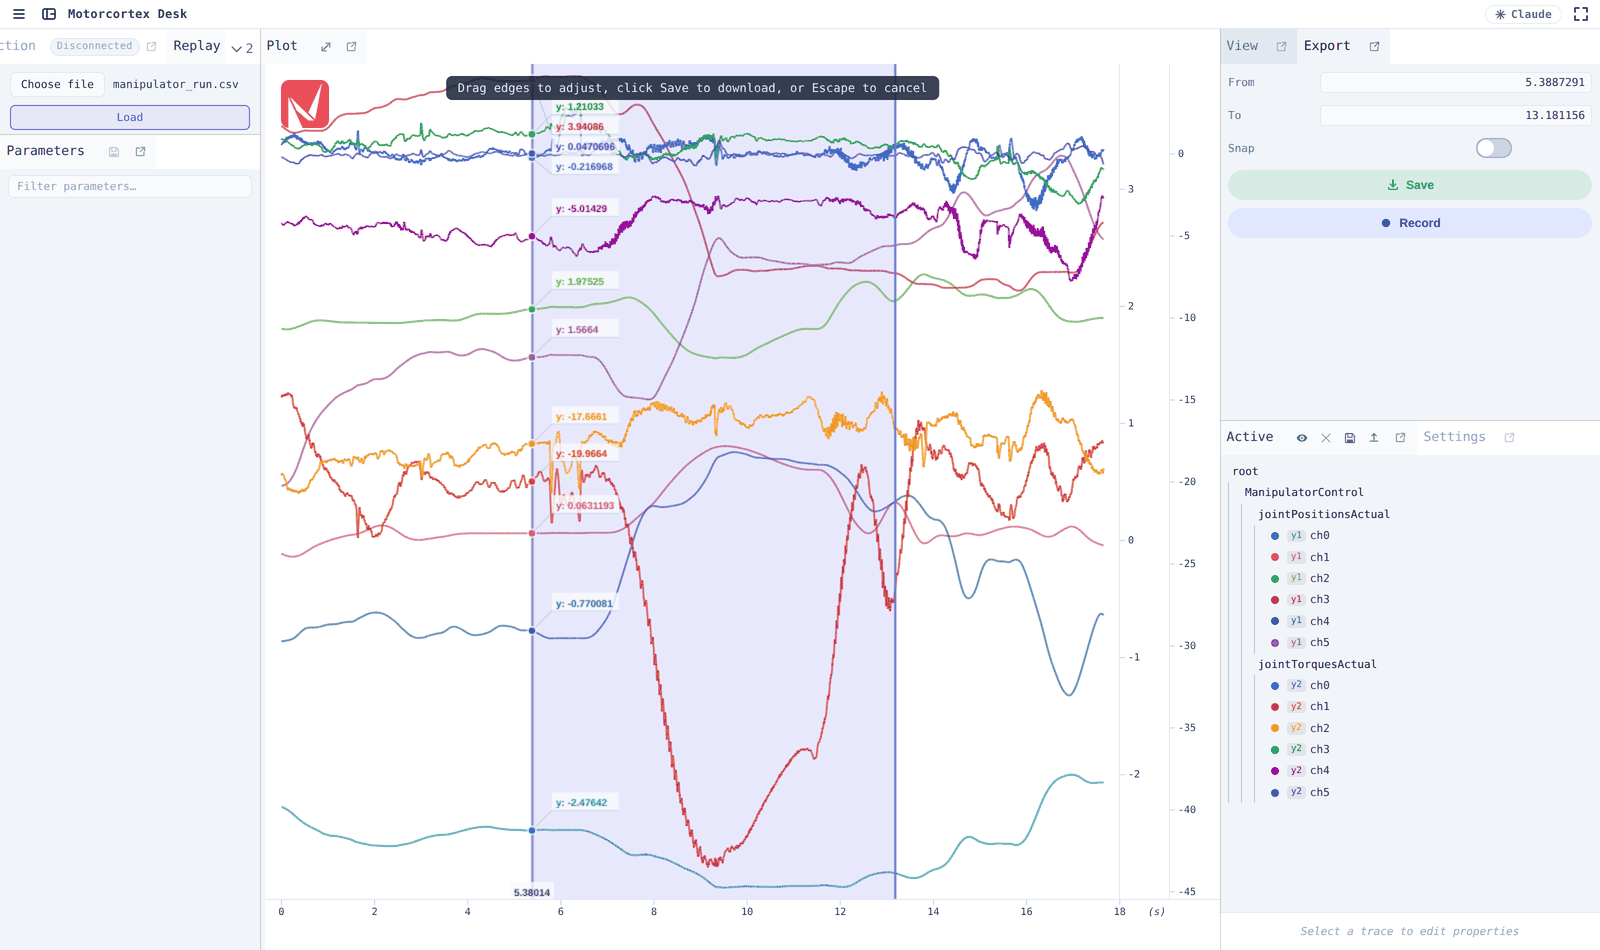
- Click Select time range. A hint appears: Drag edges to adjust, click Save to pick a file, or Escape to cancel, and the From / To boxes appear below the buttons.
- Drag across the plot to mark the range. The band shows the Y value of every trace at its left edge, so you can check you caught the event you meant.
- Drag either edge to fine-tune, or type exact values in From / To.
- Click Save. The browser’s own Save dialog opens, with a generated name already suggested, and that is where the file name and folder are chosen.
Press Escape at any point to cancel. The button never writes a file on the first press. It opens the selection, and only Save goes on to the dialog. Dismissing that dialog leaves the selection on screen, so nothing is lost by changing your mind.
Note
Saving a range that contains no samples reports ‘No data in the selected time range’ and leaves the band on screen, so you can drag it onto data instead of starting the selection again.
If From is later than To, the two are sorted rather than rejected, so a range typed the wrong way round still exports.
The Statistics panel selects its range the same way, with its own band; the two do not interfere.
Naming a time by clicking the plot
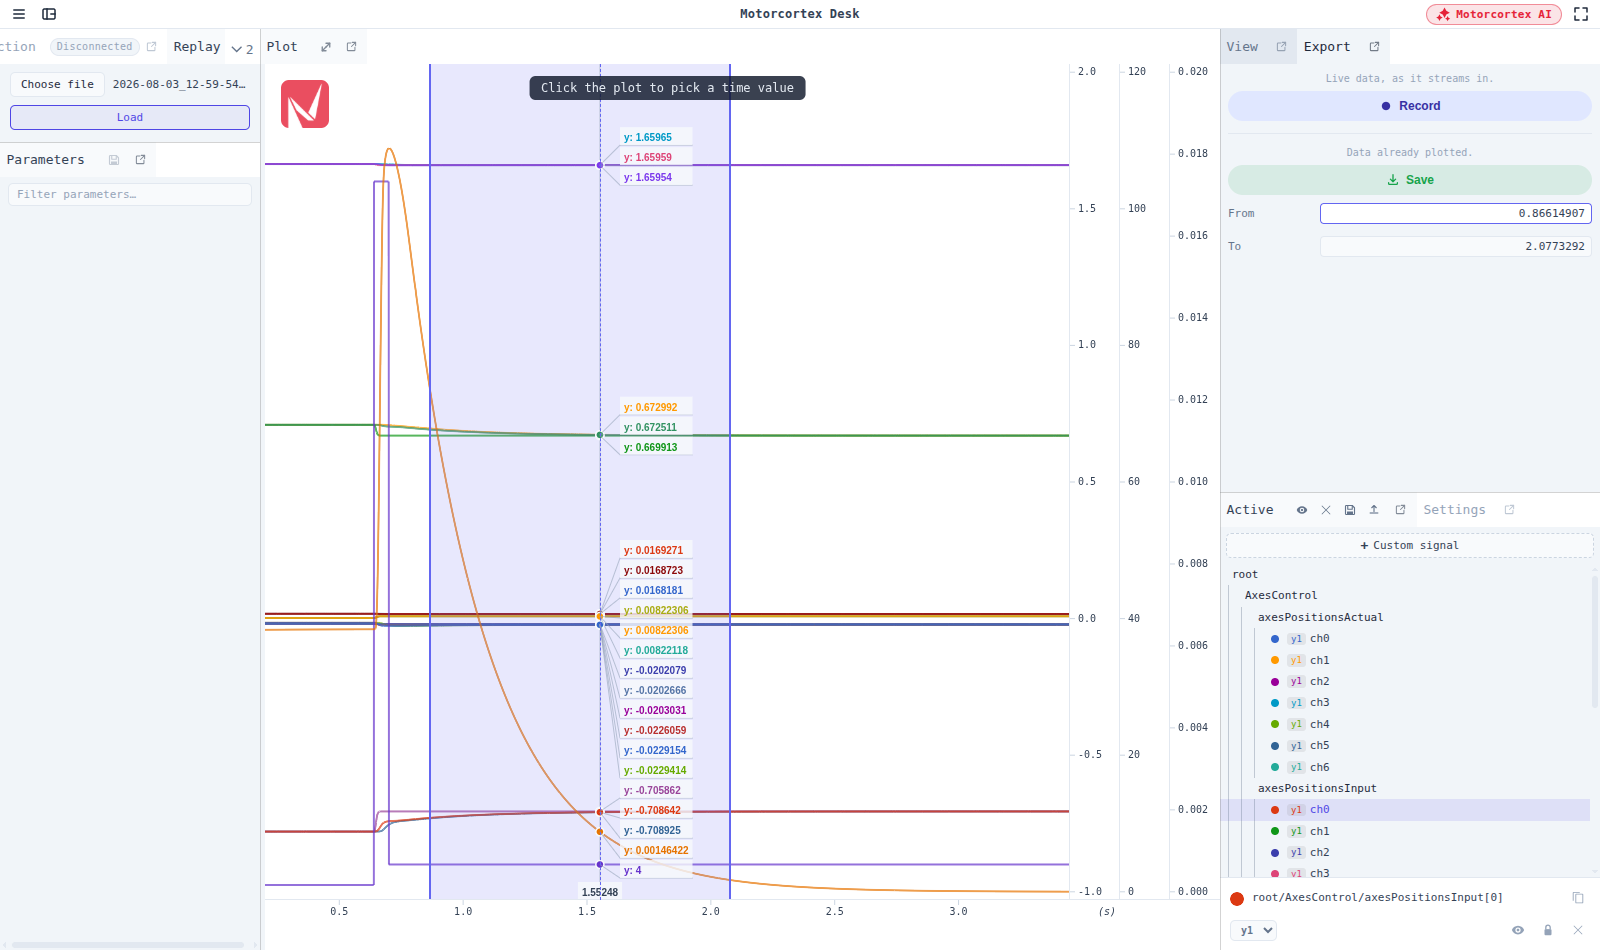
Typing an exact time is often easier than dragging to it. Click into From or To and the plot becomes a time picker: Click the plot to pick a time value appears above it, a dashed vertical guide follows the pointer, the pointer itself turns into a vertical bar, and a click writes the X under it into the focused box.
Picking From hands the picker straight to To, so a whole range is two clicks on the plot and nothing else. The picker closes when you click away from the box.
CSV format
The suggested file name is YYYY-MM-DD_HH-MM-SS_PlotData.csv. The first column is time in milliseconds, and each
following column is one visible trace, prefixed with its Y axis:
X Time (ms),Y1 root/ManipulatorControl/jointPositionsActual (ch. 0),Y2 root/ManipulatorControl/jointTorquesActual (ch. 0)
0.000000000,0.01690506241,-2.145820847
3.000000000,0.01690712104,-2.145851771
- Rows are the union of all trace timestamps, sorted; a cell is empty when that trace has no sample at that time.
- Values carry 10 significant digits.
- The
Y1…Y4prefix and the(ch. N)suffix let Replay restore each trace to its original axis and channel when you load the file back into Desk.
While the X axis is showing the controller’s
wall clock, a
UTC Time (ISO 8601) column is appended at the end of every row: 2026-08-25T06:25:01.162Z. It is added after the
trace columns, never inserted among them, so anything that already parses these files keeps working.
Continuous recording
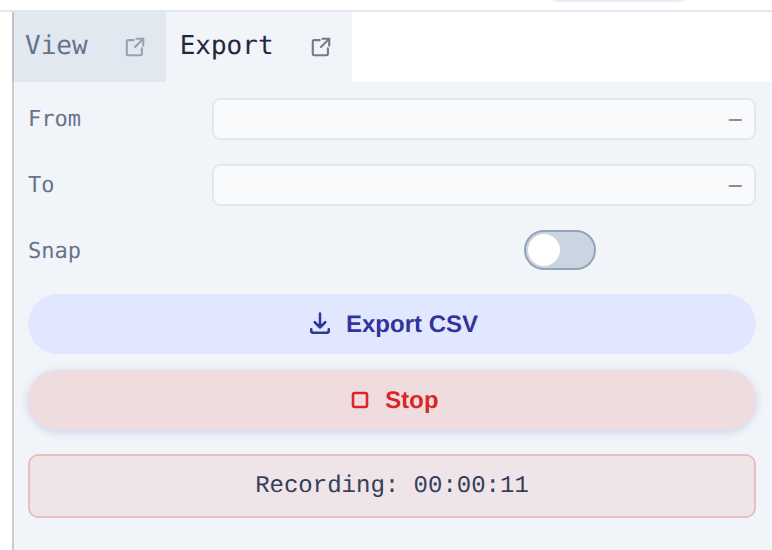
Recording captures the live stream as it arrives, independent of what the plot buffer still holds.
- Click Record. The button turns into Stop and a timer shows the elapsed time.
- Click Stop to finish. The CSV downloads immediately, without a Save dialog.
Files are named YYYY-MM-DD_HH-MM-SS_RecordedData_partN.csv.
Note
Long recordings are split. The buffer holds 1 000 000 points; at 900 000 it is flushed to …_part1.csv and the next part starts. Keep the browser open, and allow multiple downloads, until every part has been written.
Recording needs at least one visible trace, and stops by itself if the last visible trace is removed.
Saving the plot as an image
For a picture rather than the numbers, right-click the plot and choose Save as image…. See Navigating the plot.