Replay
3 minute read
The Replay panel plots a CSV file instead of a live controller, useful for looking at a recording after the fact, comparing two runs, or analysing data captured on a machine you cannot reach. It is hidden by default; switch it on in the View menu.
Loading a file
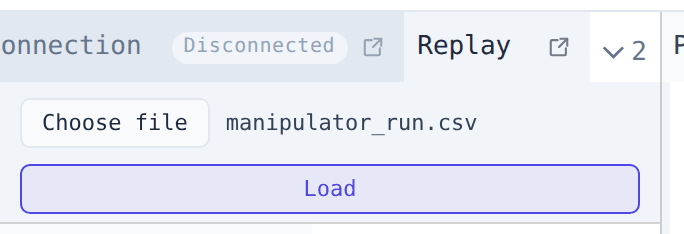
Click Open CSV… and pick a .csv file. It loads as soon as you choose it: there is no second step to confirm.
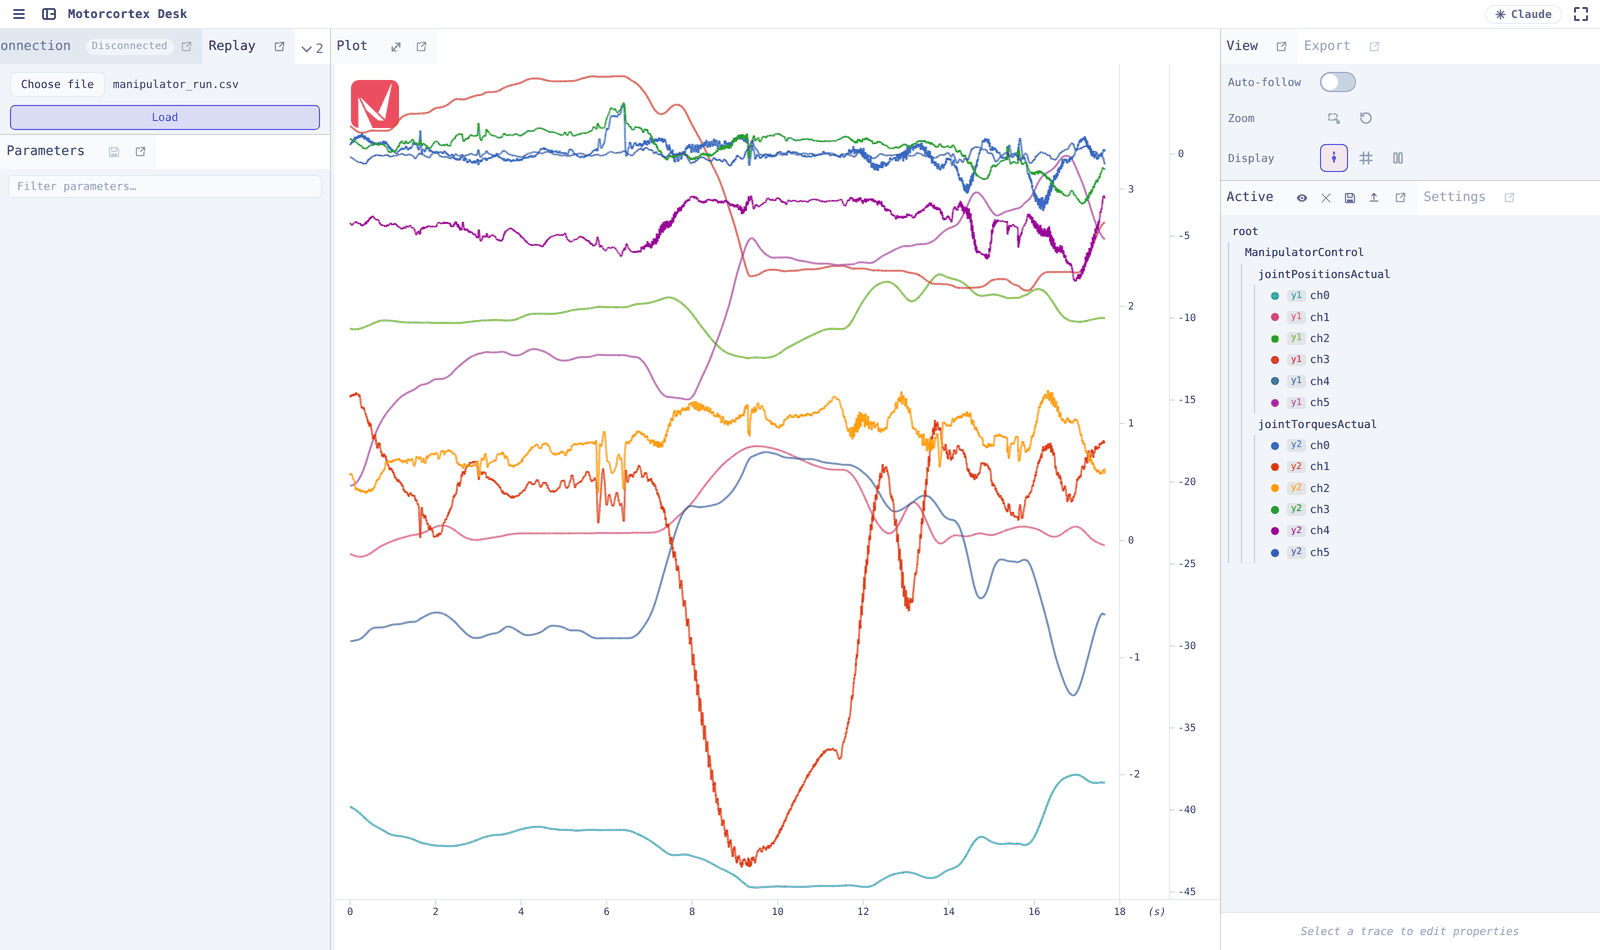
A toast reports the result, e.g. Loaded 12 traces, 60000 points. The file name replaces No file loaded beside
the button, every column becomes a visible trace, the plot fits the whole recording, and auto-follow is switched
off: there is no trailing edge to follow.
Picking the same file again reloads it, so a recording that is still being written can be re-read as it grows.
From here everything works as with live data: zoom and pan, cursor readouts, measurements, statistics, range export, colours, axis assignment and hiding. See Plotting.
Replay and live data are exclusive
Loading a file disconnects an active controller session, and clicking Connect clears the loaded traces. Desk switches modes for you; nothing has to be disabled first. While in replay mode the Parameters tree stays empty, since there is no controller to read.
The X axis stays in elapsed seconds during a replay. A CSV records an offset from an origin it does not name, so there is no absolute timeline for the wall-clock time base to show.
Accepted CSV format
The first column is the timestamp in milliseconds; X values are plotted relative to the first row, so the plot starts at 0 s. Every other column is one signal, and the header tells Desk what it is:
| Header form | Produced by | Result |
|---|---|---|
Y1 root/path/signal (ch. 0) |
Desk CSV export | Signal on axis y1, channel 0 |
Y root/path/signal |
older Desk exports | Signal on y1 |
root/path/signal[0] |
controller-side recorders | Signal on y1, channel 0 |
A UTC Time (ISO 8601) column is recognised as a second rendering of the timestamp and is not imported as a trace.
Cells that are not numbers (string enums, blanks) are skipped as gaps in that trace, so a mixed file still loads; a column with no numeric data at all becomes an empty trace.
Auto-sort Y axes
When the file carries no axis information in its headers, an Auto-sort Y axes switch appears under the file
name once the traces are on screen. It is on by default: Desk spreads the columns over y1–y4 by the order
of magnitude of their values, so signals of wildly different scale do not crush each other on one axis. Files
exported from Desk already carry their axes, so the switch is not shown for them.
Flipping it re-lays the file out without re-reading it, and the choice sticks for the next file you open.
Note
Auto-sort looks at magnitudes only. It knows nothing about units. Check the assignment afterwards in the Active panel and move traces where you want them.
Large files
Parsing runs in the browser and yields periodically, so the window stays responsive and shows a loading toast. Traces are sized to the file, so no points are dropped. Very large recordings (hundreds of megabytes) are still limited by the memory available to the browser tab. Export a narrower time range or fewer signals if loading fails.