Settings
2 minute read
The Settings panel holds appearance and rendering options. Every change applies immediately.
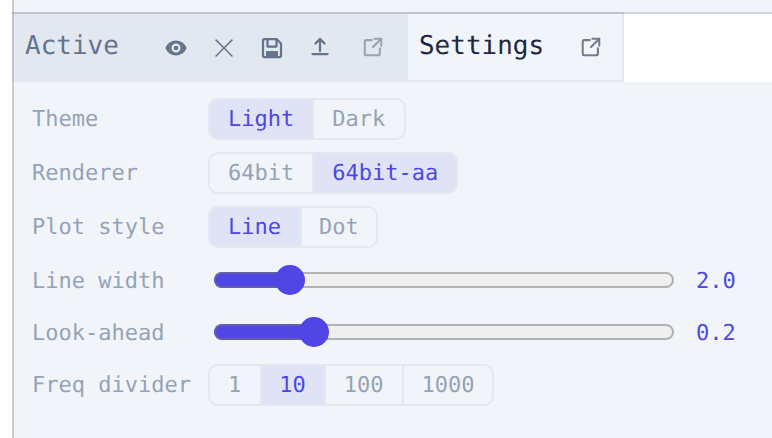
Theme
Light or Dark. The choice is remembered; with no choice made, Desk follows the operating system setting and keeps following it until you pick one.
Renderer
How trace geometry is computed on the GPU. Switching the renderer rebuilds all traces.
| Mode | Description |
|---|---|
| 64bit | Emulated double precision, single-pixel lines. Lowest GPU cost. |
| 64bit-aa | Same precision with anti-aliased, width-adjustable lines. Default. |
Both modes keep full precision on large X values (long sessions with millisecond timestamps), which is what prevents traces from drifting or stair-stepping at deep zoom.
Line width and point size
One slider, labelled for whichever trace style is selected in the View panel: Line width (1.0 – 8.0 px) while traces are drawn as lines, Point size while they are drawn as dots. The Line/Dot switch itself lives in View, on the Traces row. See Navigating the plot.
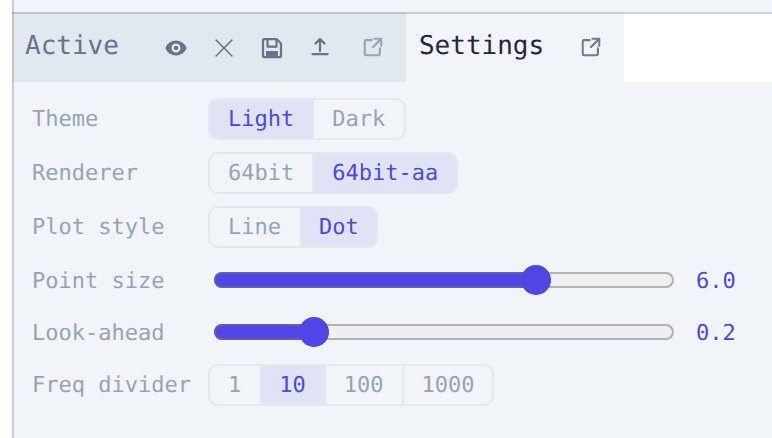
Note
Line width only has a visual effect with the 64bit-aa renderer; 64bit always draws one-pixel lines.
Selecting signals in the Active panel temporarily thickens their traces on top of this setting.
Look-ahead
How briskly the view follows incoming data while auto-follow is on, from 0 (very smooth, lagging) to 1 (snaps to the newest sample). Default 0.2.
It also sets how a live statistics range grows: a window whose end sits at the live edge jumps forward in look-ahead-sized steps rather than creeping every tick. See Analysing.
Freq divider
How much of the controller’s publish rate Desk subscribes to: the controller sends every n-th tick.
| Divider | Effect |
|---|---|
| 1 | Every tick. Maximum detail, highest network and CPU load |
| 10 | Default; a balance between detail and load |
| 100 | Coarse. Light load, suited to long observation |
| 1000 | Minimal rate for slow monitoring |
Changing the divider resubscribes all traces, which clears the data already plotted. Pick the divider before a measurement run rather than during it.