Measuring
2 minute read
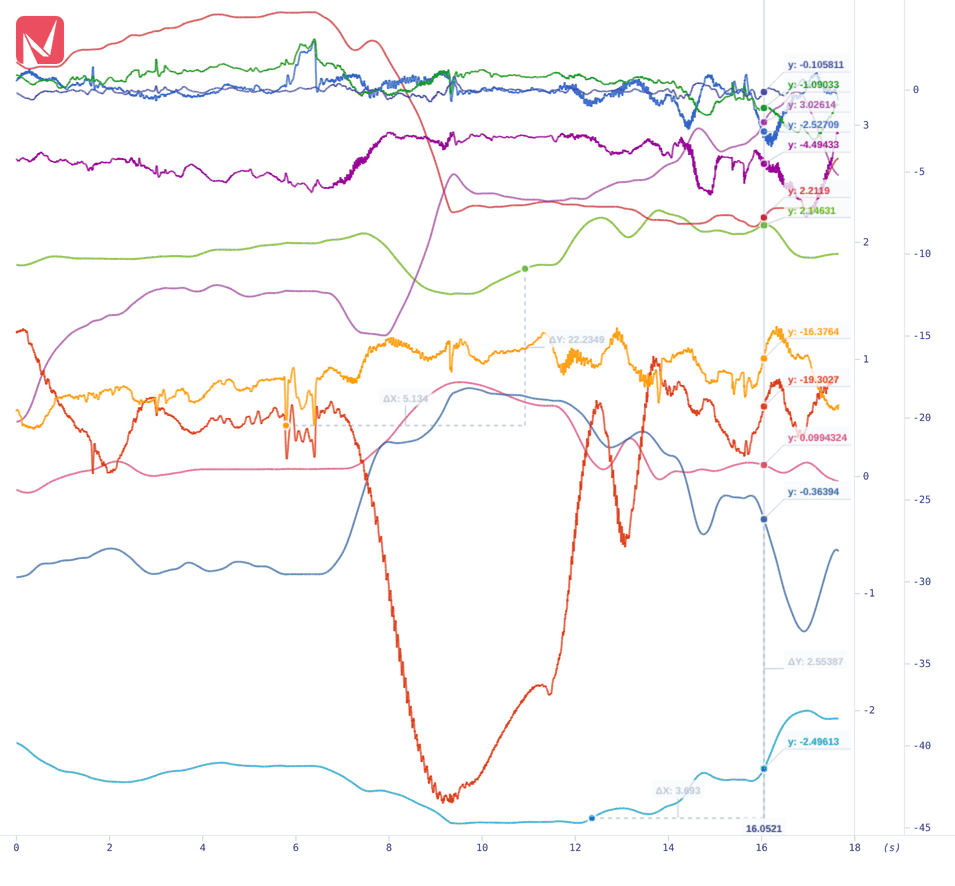
The Measure panel places pairs of points on traces and reports the difference between them. It is hidden by default. Switch it on in the View menu of the top bar.
Adding a measurement
- Click Add Point Pair. The button changes to Click on trace… (cancel) and the pointer becomes a crosshair.
- Click a trace to set P1.
- Click again, on the same trace or another one, to set P2. The pair is committed and a card appears.
The button is disabled while no visible trace exists. Click it again to abort a capture in progress.
While capturing, a click on a trace goes to the measure tool rather than selecting it in the Active panel. Dragging still zooms to the area you draw: a press that moves more than five pixels is a drag, not a point.
Reading a card
| Field | Meaning |
|---|---|
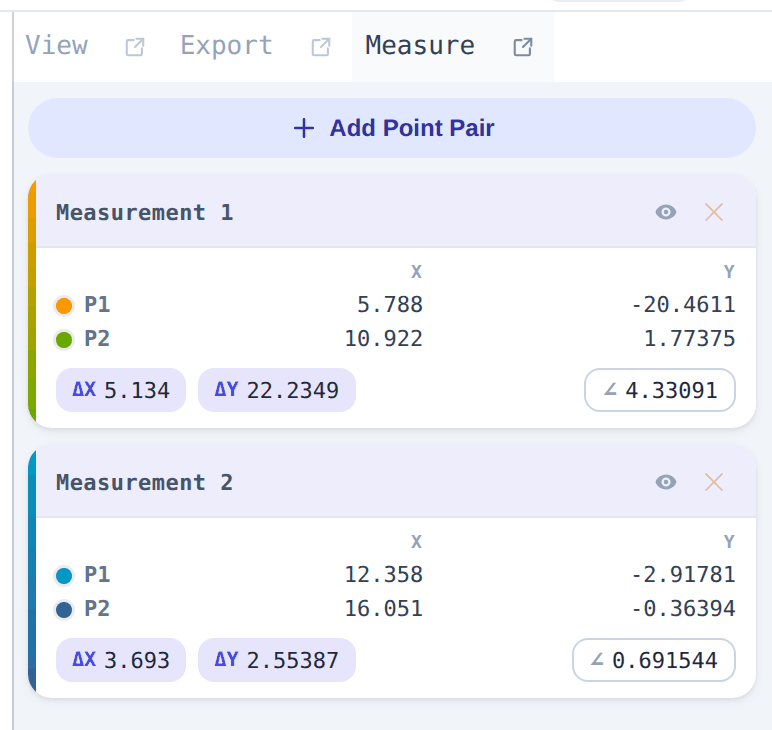
| P1, P2 | X and Y of each point; the dot shows which trace it sits on |
| ΔX | Absolute difference in X (time, in seconds, in time mode) |
| ΔY | Absolute difference in Y |
| ∠ | Slope ΔY / ΔX. Signed, so it also gives the direction |
With the X axis on the controller’s
wall clock, the P1 and
P2 X values read as full 2026-08-25 06:25:01.162 UTC stamps. ΔX stays a duration either way.
The coloured bar on the left edge of a card carries both point colours, which makes cross-trace measurements easy to recognise.
Managing measurements
- Add as many pairs as you like; each gets its own card.
- Eye: hide the markers on the plot without deleting the measurement.
- ✕: delete the measurement.
Measurements are anchored to their trace: removing a trace also removes the measurements taken on it.
For statistics over a whole stretch of signal rather than two points, see Analysing.